01 · Data Science / Healthcare
Advay
Bhattacharya
Statistics @ Texas A&M · 2× UHG Analytics Intern · New Grad 2027
I got into data knocking on doors for a congressional campaign, and more doors stayed shut than opened. Figuring out who wasn't answering and why is what got me hooked on pulling census data to find the pattern instead of guessing. These days that same instinct is what I bring to healthcare data at UHG, where the missing piece is usually a misallocated claim or an undocumented diagnosis instead of a voter behind a door.
$39.6B
revenue analyzed at UHG
5M+
accounts consolidated
83%
reporting time cut via automation
02 · About
About Me
My journey with data started out low-tech. I spent a summer knocking on doors for a congressional campaign, and I expected to analyze turnout from an office instead of walking it. Most neighborhoods didn't answer. Somewhere past the fiftieth shut door, it stopped looking like a canvassing problem and started looking like a targeting problem, so I pulled census data on who wasn't showing up to vote and found a block of college-age voters the campaign wasn't touching at all. At Texas A&M, I built on that instinct through educational research, digging into the mathematical foundations of machine learning with regression and structural equation modeling. I've carried that same curiosity into other domains too. In construction science, I built k-nearest neighbors models to flag likely cost overruns on TxDOT highway projects. At UHG, I connected theory with business impact by analyzing payer mix and cash flows, showing how data insights translate into ROI. I returned to UHG for a second summer on the Risk Adjustment Service Offering team, where I independently redesigned SLA compliance reporting for a health plan client, replacing a manual process with an automated Power BI dashboard that cut reporting time 83%. Across politics, education, construction, and healthcare, my focus has been consistent in using data to find the people or patterns everyone else is missing, and doing something about it.
The through-line across all of it is the same question. A Vietnam war veteran on a quiet suburban street who asked us to stay and talk about the future of the country. A family at a Diwali event at the local football stadium who had just arrived in America and signed up to vote for the first time. A trailer-park community that had been written off as nonvoters not because they were disengaged but because nobody had looked closely enough at the census data to find them. At UHG, the same gap shows up differently: 3,200+ accounts worth over $160M routed to the wrong vendors, invisible to the people managing the system. A for-profit health plan client whose revenue flows directly to the Medicare communities they serve. The work looks like SQL and Power BI. The reason it matters looks like those people.
- Education
B.Sc. Statistics, minors in CS & Economics
Texas A&M University · Aug 2023 – May 2027
- Leadership
Co-Captain, TAMU Mock Trial Team
Mentorship, public speaking, legal research
- Service
A&M Big Event · MOVE Texas · UHG Community Day
House painting, voter registration, bikes & backpacks for underserved communities
- Interests
Art, chess, swimming, pickleball
Balancing analytical thinking with creative pursuits


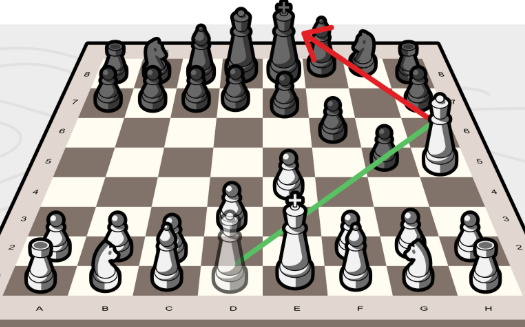
Chess

Swimming

Pickleball

Art
03 · Experience
Work Experience
Analytics Intern (Return) · Risk Adjustment Service Offering
UnitedHealth Group
- Redesigned SLA compliance reporting for a health plan client, replacing a manual Excel process with a Power Apps + SharePoint List pipeline feeding a Power BI dashboard
- Cut manual reporting time 83% (4 hrs/week to 40 min/week) by automating data entry and refresh across ~400 tracked SLA data points monthly
- Validated and consolidated fragmented historical SLA data into a single unified query, establishing the dashboard's source of truth
- Resolved 80+ bugs through multi-phase testing, authored technical documentation, led KT sessions for handoff, and presented the finished solution to senior leadership
Analytics Intern · Revenue Cycle Management
UnitedHealth Group
- Deployed Power BI dashboard analyzing 5M+ accounts / $39.6B revenue, consolidating 170+ sources; uncovered 98% year-over-year growth in high-value customers
- Identified critical revenue cycle discrepancies through SQL + Power Query pipelines, uncovering 3,200+ accounts ($160M+) erroneously assigned to third-party vendors, enabling recovery of misallocated claims
Undergraduate Researcher · ML for Pediatric Cardiac Monitoring
Independent Research (with Kathan Vyas)
- Built a time reconstruction pipeline converting each patient's relative sensor timestamps into absolute datetimes across 14 patients' HDF5 physiological recordings, catching and fixing a file sorting bug that had scrambled several patients' reconstructed timelines
- Ran integrity diagnostics across all 14 patients checking timestamp monotonicity, missing data blocks, and data coverage around each clinical event, flagging which patients had enough data for the planned modeling window
- Built a signal combination pipeline comparing arterial and non-invasive blood pressure channels per patient, merging redundant sensor streams only when readings agreed within a set threshold
- Traced a physiologically impossible blood pressure average back to a mixed sensor sampling rate bug in the raw files, catching a data quality issue before it reached the model
Undergraduate Research in ML
Texas A&M University (Dr. Ashrant Aryal)
- Built a K-Nearest Neighbors model classifying likely change orders across 800K+ TxDOT highway project line items
- Applied case-based reasoning with custom multi-label evaluation metrics (Jaccard, Hamming loss, ROC-AUC) to handle a heavily imbalanced dataset
- Engineered pivot-table features from raw engineer-estimate and as-built cost records to structure inputs for the model
- Merged multiple 900,000+ row datasets, working around SQLite's query performance limits by chunking the process instead
Undergraduate Researcher · LIVE Lab
Texas A&M University (Dr. Michael Rugh)
- Ran Structural Equation Modeling (SEM) and Confirmatory Factor Analysis (CFA) in STATA on faculty survey data to identify what drives attitudes toward game-based learning
- Co-designed and facilitated a summer camp study of 30 middle schoolers playing an educational calculus game, then thematically coded 30 surveys and 6 interviews (181 coded text chunks)
- Co-authored a paper published in ASEE PEER (Work in Progress track, 2025) and presented it at the American Society for Engineering Education national conference
04 · Work
Featured Projects
01
Coinvo AI Financial Advising Platform
TAMUHack 2025 · 2nd Place Winner
2nd place · ~536 participants
Coinvo is a financial co-pilot my team built from scratch in a single hackathon weekend, our first fully shipped web app together. The idea came from feeling overwhelmed by financial tools that show data without context: Coinvo pairs a live stock ticker with an OpenAI-powered assistant that can actually answer follow-up questions about what you're looking at, instead of returning a canned response. Biggest technical hurdle was wiring three separate services (Flask, FastAPI, Streamlit) together and keeping frontend/backend state in sync under a hard deadline.
- Built a Flask + FastAPI backend serving live market data pulled via the yfinance API
- Integrated OpenAI's API for a context-aware assistant that handles follow-up questions, not just one-off queries
- Designed a persistent watchlist so users can track selected stocks across sessions
- Shipped a working end-to-end product as a team in one hackathon weekend, placing 2nd at TAMUHack 2025
02
Lung Cancer Detection from CT Scans
Deep Learning for 5-Class CT Classification
91.2% accuracy · 41-pt gain over baseline
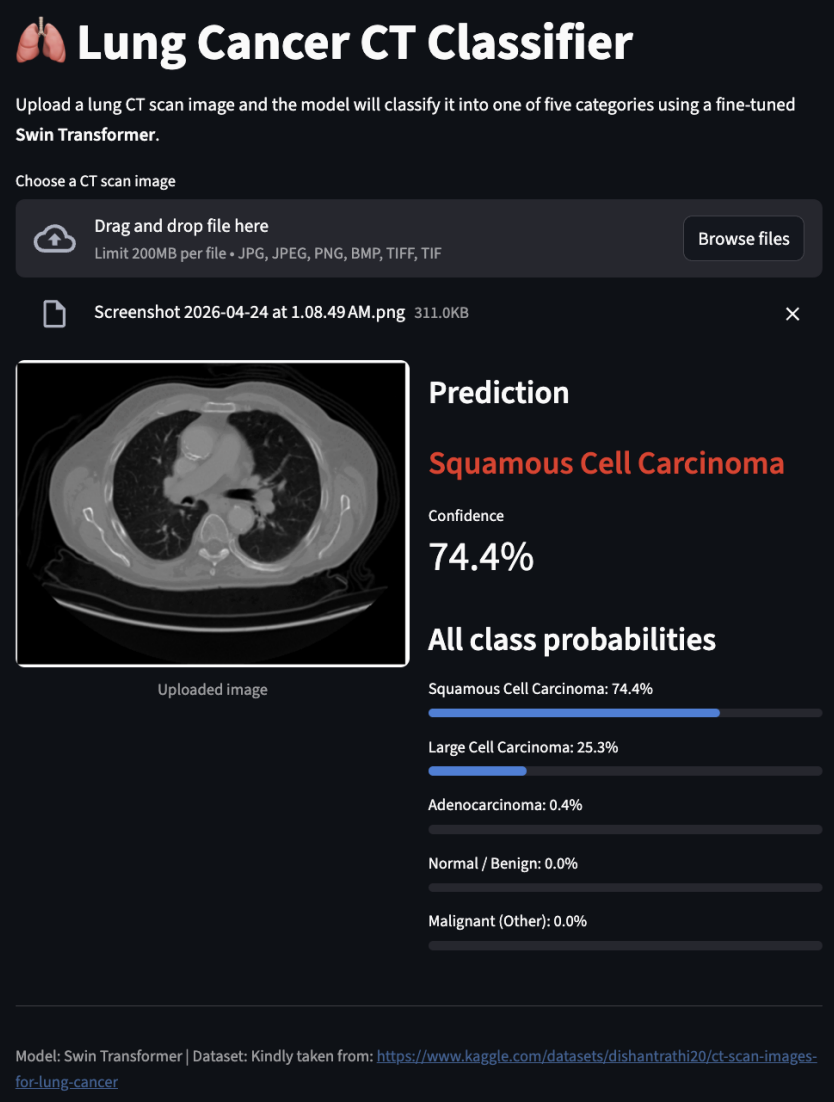
A team project comparing four approaches to automated lung cancer detection from CT scans, from a classical PCA and logistic regression baseline up to a fine-tuned Swin Transformer. Rather than stopping at the best-looking number, we ran a controlled test isolating one variable at a time, whether the model started from a domain-adapted checkpoint or generic ImageNet weights, holding everything else identical. The result runs live as a Streamlit app that takes an uploaded CT scan and returns a predicted cancer subtype with a confidence score.
- Compared 4 modeling approaches under identical conditions, from PCA + Logistic Regression (50.9% accuracy) to a fine-tuned Swin Transformer, reaching 91.2% test accuracy and 0.91 macro F1
- Isolated checkpoint initialization as the key transfer learning variable; identical fine-tuning from a domain-adapted checkpoint beat fresh ImageNet weights by 7.6 points (91.2% vs. 83.6%)
- Rebalanced a 1,460-image, 5-class training set with inverse-frequency loss weighting after the classical baseline missed 93% of the most common cancer subtype
- Team deployed the trained model as a live Streamlit app, returning a predicted subtype and confidence score for any uploaded CT scan
03
Student Engineering Council Survey Analysis
Multi-Year Sentiment & Predictive Modeling
0.78 ROC-AUC · students and recruiters, 3 years of data
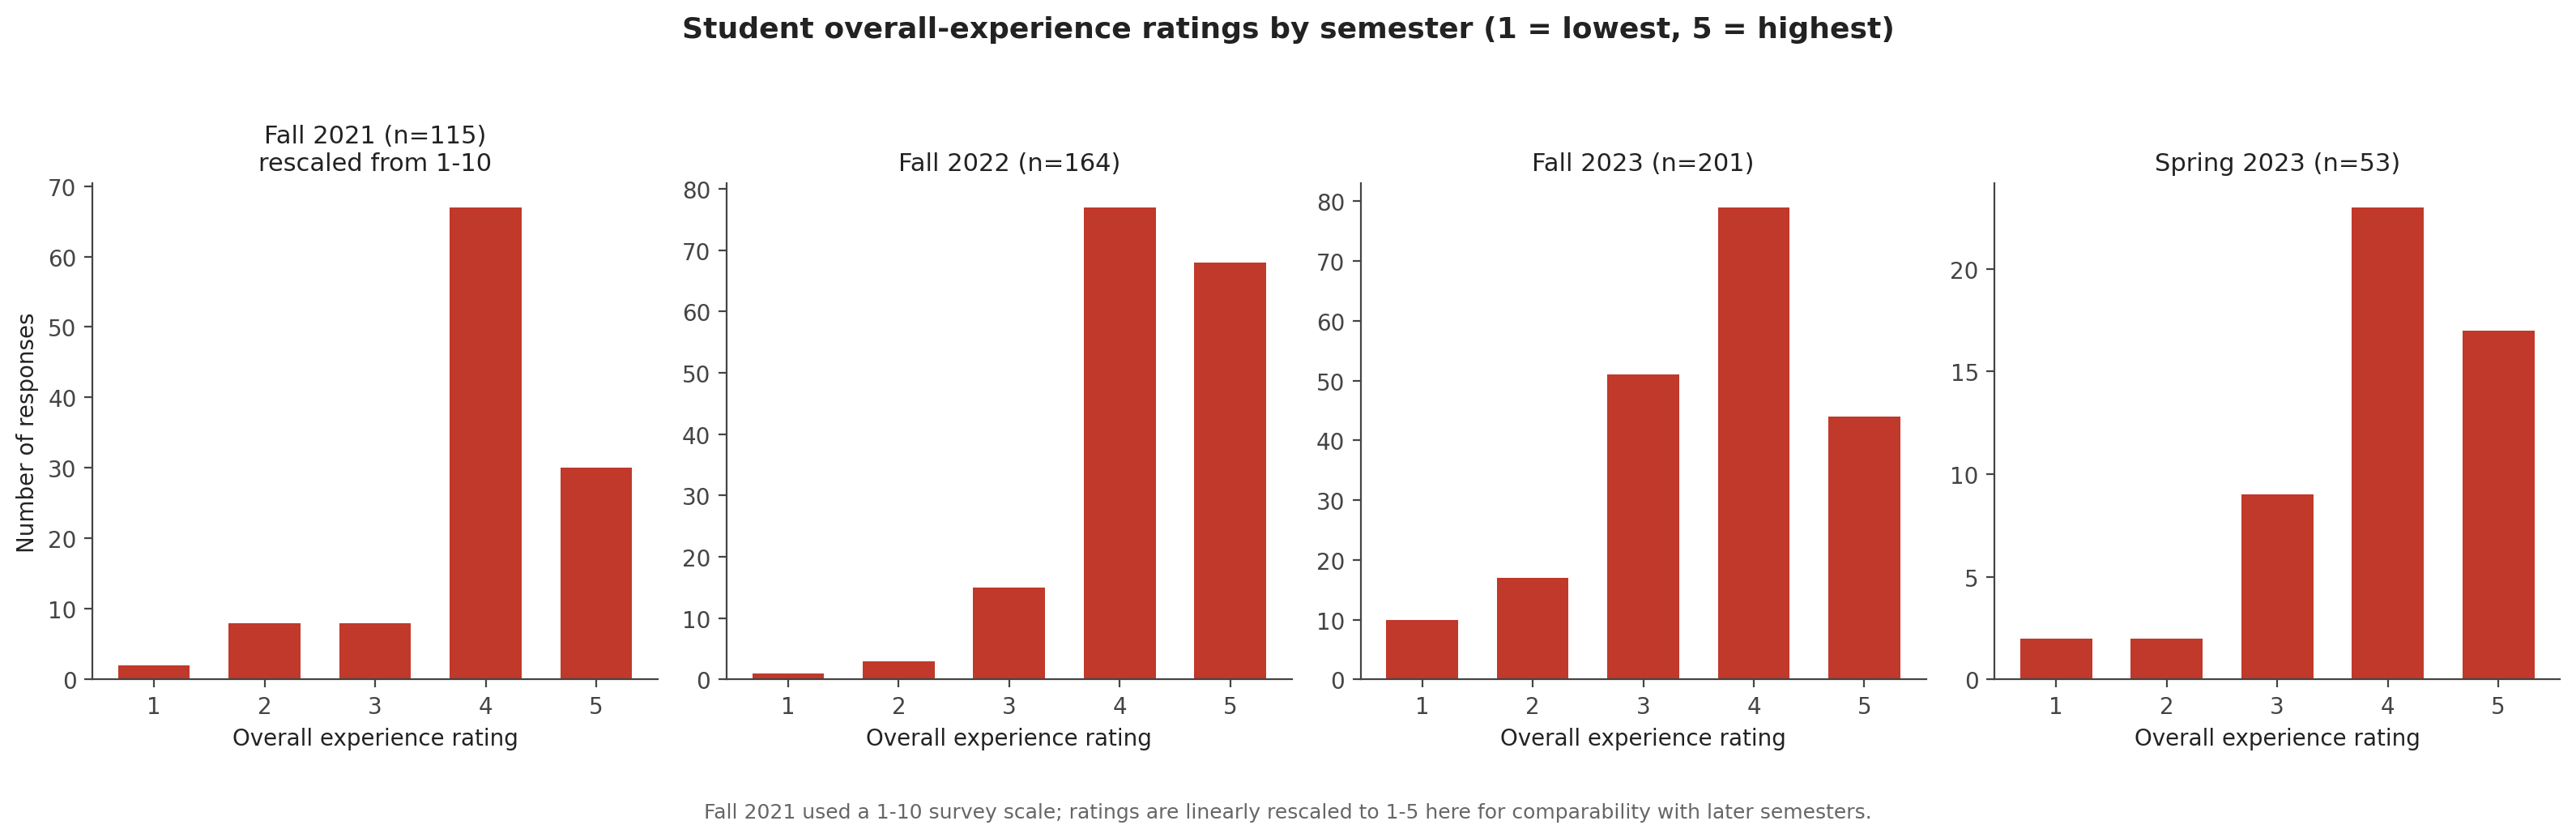
A longitudinal analysis of Texas A&M's Student Engineering Council recruiting surveys spanning 2021-2023, combining NLP sentiment analysis on open-ended student and recruiter feedback with predictive modeling on the structured responses from both populations. Before trusting any downstream model, I tested whether missing survey responses were actually missing at random rather than assuming it, a step that turned out to matter since one semester broke the pattern.
- Ran BERT-based sentiment analysis on open-ended feedback text across three years of surveys, keeping two earlier, weaker modeling attempts (9% and 35.4% accuracy) documented in the notebooks rather than deleted
- Tested nonresponse patterns for randomness before imputing missing values, catching one semester (Fall 2022) where nonresponse was statistically non-random (p = 0.04) rather than assuming MAR by default
- Compared Random Forest and XGBoost on the structured survey data; predicting the exact 1-5 rating topped out at 48.6% accuracy, but collapsing to positive vs. negative reached 76.6% accuracy and 0.78 ROC-AUC
- Extended the analysis to five semesters of recruiter survey data no one had touched, finding recruiter satisfaction tracks communication rating almost one-to-one (r = 0.55) while the same relationship is far less consistent on the student side
- Found the same pattern held even in a semester whose survey asked completely different questions: signage and check-in smoothness explained 47% of one semester's rating variance where communication wasn't even asked about, pointing to a consistent theme (operational clarity, not amenities) across five differently-worded instruments
- Built a small interactive Streamlit app on a leaner version of the binary model, so anyone can test how attendance and survey ratings shift the predicted probability of a positive rating
04
GM EV Adoption Prediction
Aggie Data Science × General Motors Challenge
0.75 ROC-AUC · caught and fixed a data leakage bug
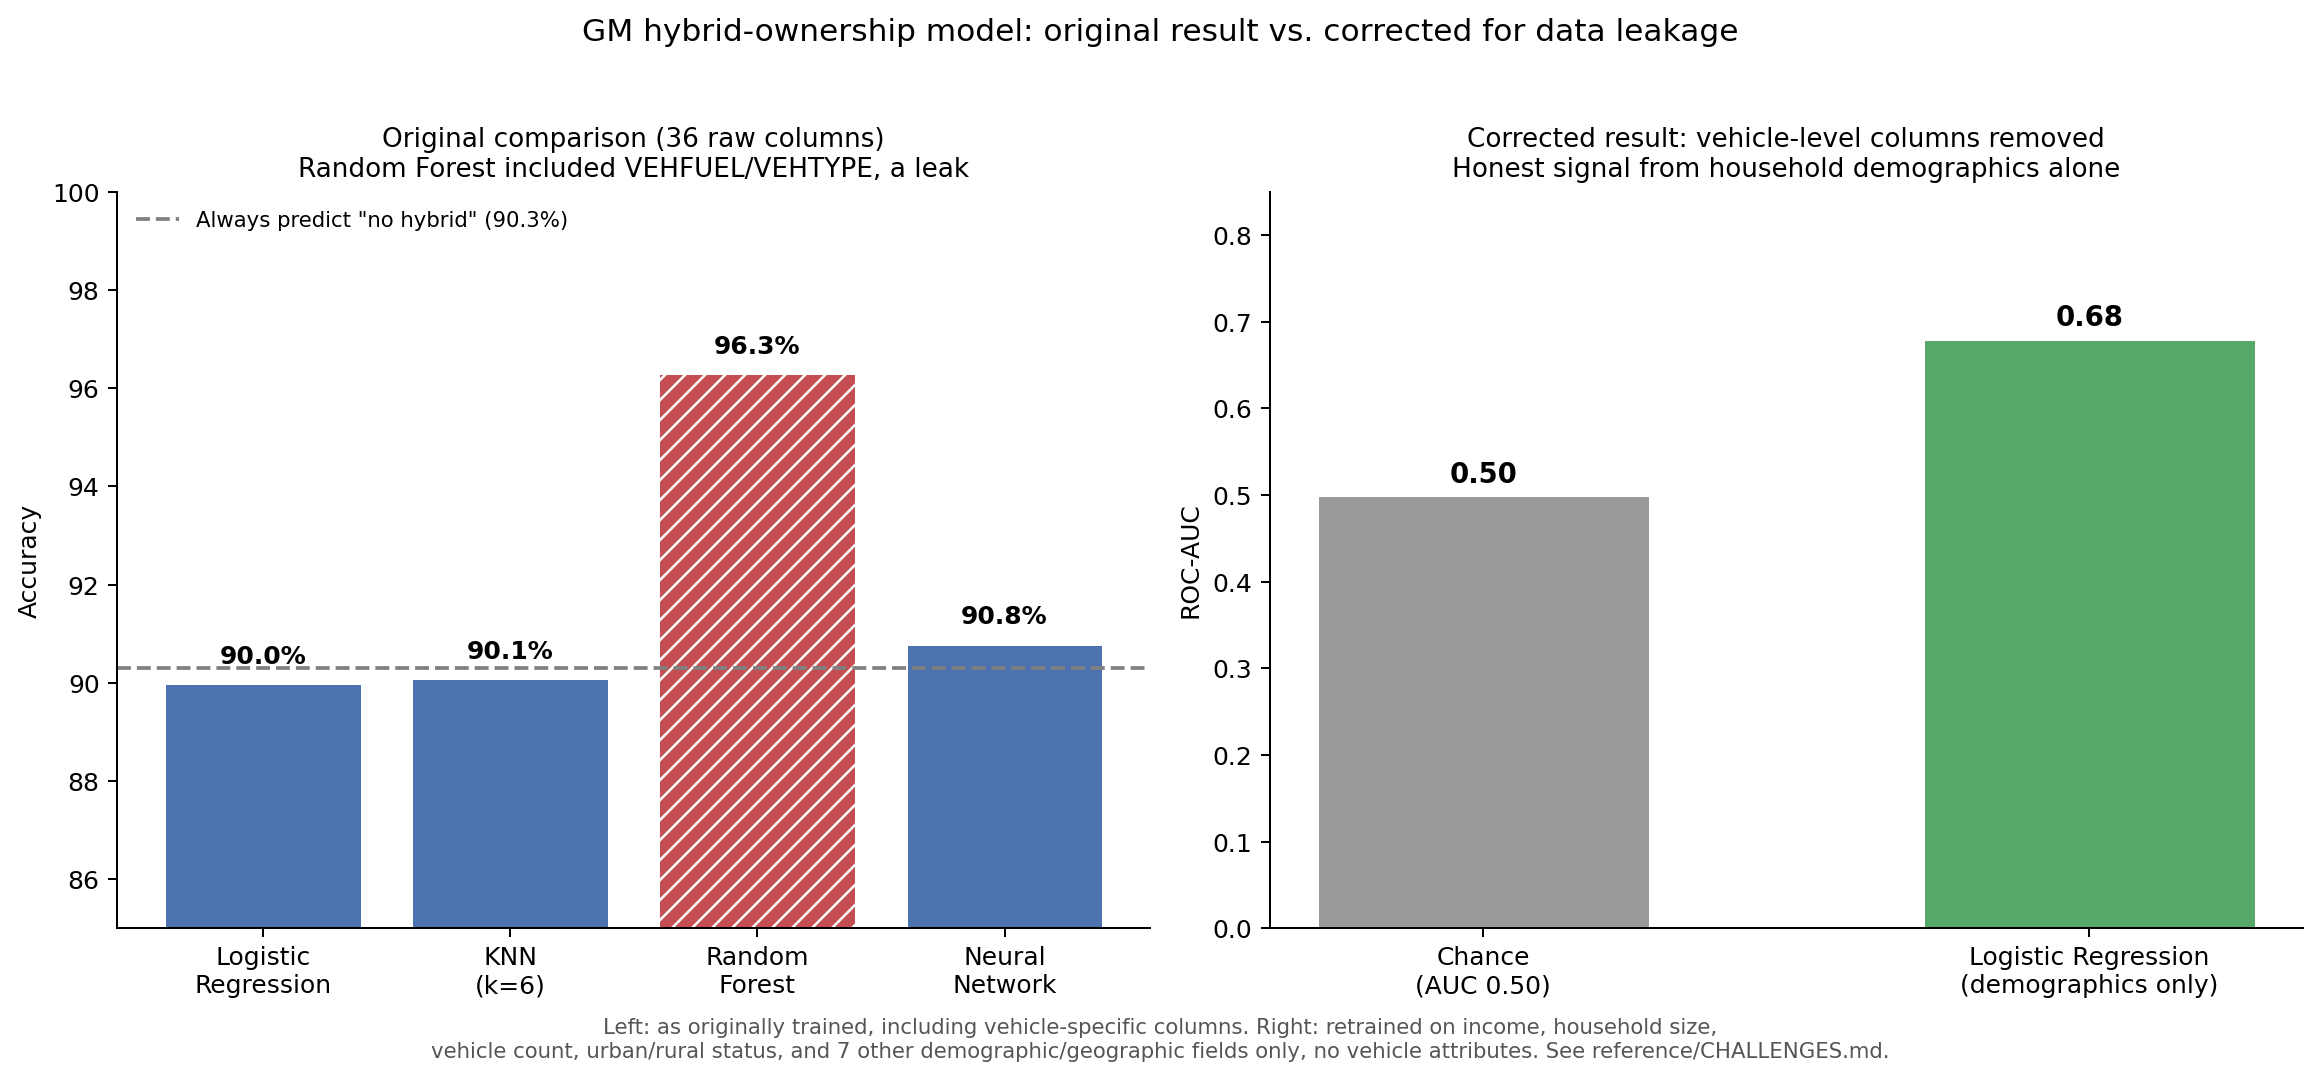
A data challenge General Motors brought to Texas A&M's Aggie Data Science, predicting which households are likely to own a hybrid or electric vehicle. Working from National Household Travel Survey data, I merged household and vehicle records, engineered a household-level hybrid-ownership target, and compared four models, then caught a data leakage problem in the original result, retrained a corrected version, and spent eight further rounds of feature engineering closing the gap it opened, each round tested against a cross-validated baseline before being kept.
- Merged household, vehicle, and person-level NHTS survey records into a single household-level modeling dataset
- Found that the original 96.3% Random Forest result was inflated by data leakage, the model had access to the vehicle's own fuel-type code, which predicts hybrid ownership with 100% certainty on its own
- Retrained on demographics and geography alone first (0.68 ROC-AUC, honest but modest), then rebuilt up to 0.75 ROC-AUC with vehicle-fleet aggregates, household composition, a brand-tier proxy, person-level features, and hyperparameter tuning, all cross-validated at every step
- Applied probability calibration to a tuned XGBoost classifier, cutting Brier score from 0.184 to 0.074 with no loss in ranking ability, then tested and honestly reported three ideas that didn't help (SMOTE, trip-level data, respondent sex) instead of hiding the negative results
- Built a small interactive Streamlit app on the final calibrated model so anyone can test how income, vehicle fleet age, region, and brand tier shift the predicted probability
05
Healthcare Analytics: Medicare Claims Payment & Utilization
Statistical Analysis of 9.76M CMS Medicare Claims
9.76M claims · 43.6% adj. R²
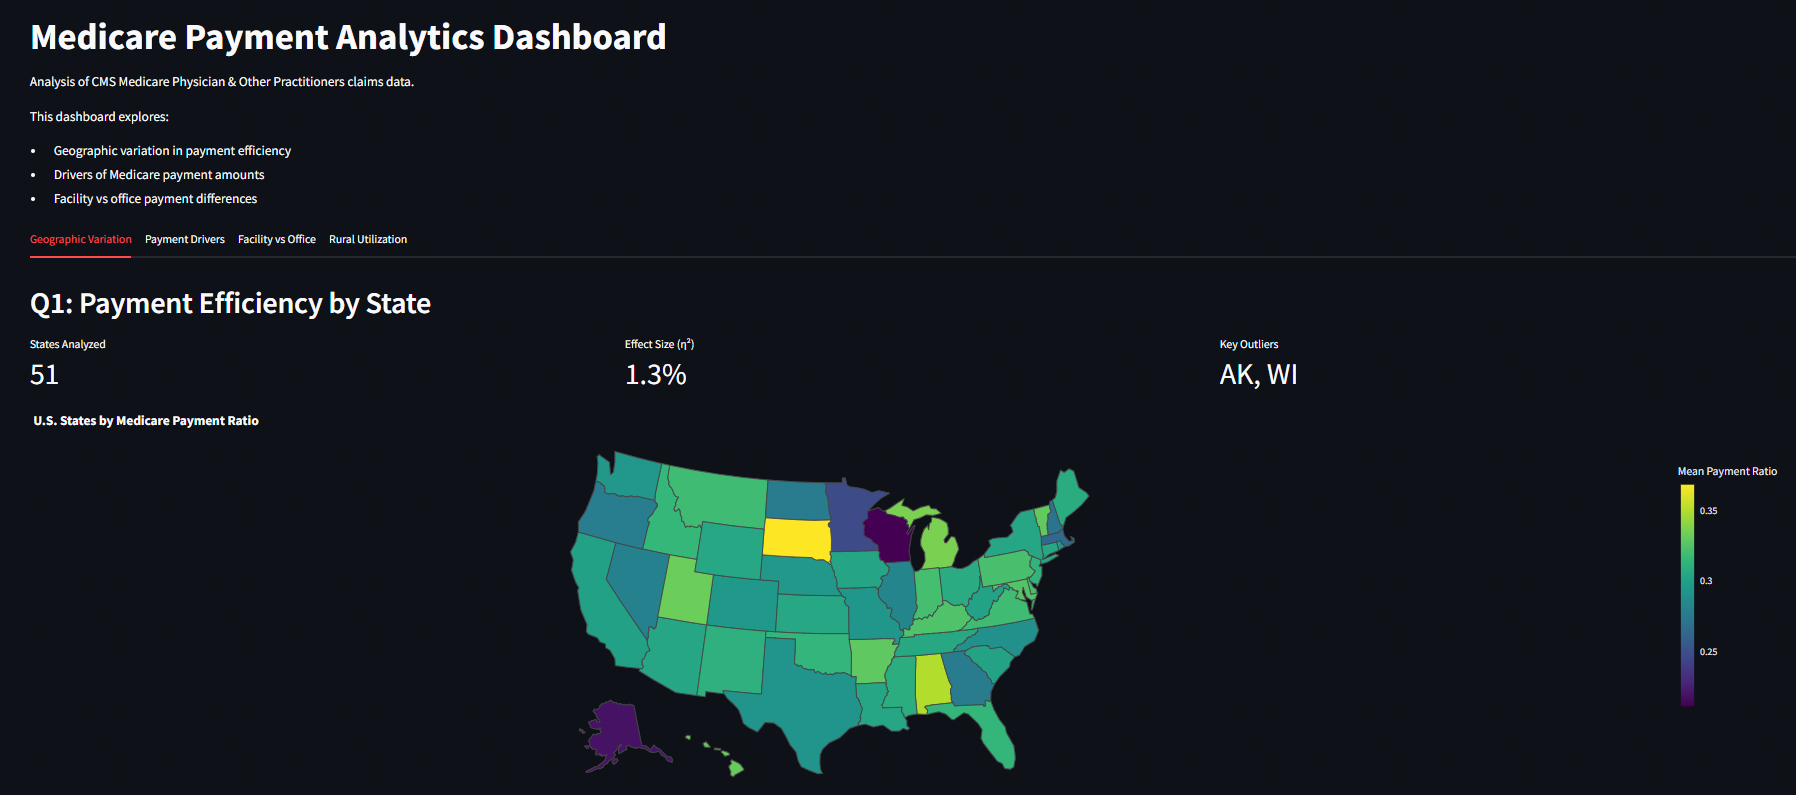
A statistical deep-dive into 9.76 million CMS Medicare Physician & Other Practitioners claims records, built to trace where variation enters the path from what a provider bills to what Medicare actually pays. Four questions, each tested formally rather than eyeballed. How much payment efficiency varies by state, what actually drives payment amount, whether facility and office settings get paid differently for the identical procedure, and where rural providers are systematically underutilized relative to urban ones. At this sample size almost anything clears p < .05, so every finding is also checked against a practical-significance threshold before it's reported as real.
- Ran ANOVA across all states (p < .001), but geography explained only ~1.3% of payment variation (η²); Alaska (highest) and Wisconsin (lowest) drove most of the pairwise differences
- Built a log-linear regression that jumped from 14.5% to 43.6% adjusted R² once procedure type (CPT/HCPCS category) was added, the single strongest predictor of payment amount
- Ran paired Wilcoxon signed-rank tests (matched by provider + procedure) across 531 tested procedures. Only 7 cleared a practical-significance bar after FDR correction, topped by cataract surgery (HCPCS 66984), which paid 10.5x more in facility vs. office settings
- Tested rural-vs-urban utilization independently across 1,497 procedure codes with Benjamini-Hochberg correction. 289 cleared statistical significance, but only 127 passed a practical-significance filter, with ~37% of those concentrated in oncology, radiation, and infusion care
- Found rural providers are still paid ~5.4% less than urban ones for the identical procedure after controlling for procedure mix, down from a raw ~10% gap, showing part of the rural/urban payment story is really about what gets billed, not just where
05 · Capabilities
Technical Skills
Programming Languages
Data Science & ML
Databases & Analytics
Development Tools
Currently expanding into deep learning and cloud computing through coursework and personal projects.
06 · Reflection
The through-line, and where it leads
So What
Door 5001. That number is in my college application because it was the one where the work started to feel real. My supervisor and I had been walking neighborhoods for a congressional campaign, and somewhere past a thousand doors I stopped thinking of the job as voter outreach and started thinking of it as a data problem with a face on it. A Vietnam war veteran on a quiet street who asked us to stay and talk about the future of the country. A family at a Diwali event at the local football stadium who had just arrived in America and signed up to vote for the first time, then got their sons involved. A community in a trailer park that had been marked as nonvoters not because they were disengaged but because the targeting data had never looked closely enough to find them.
At UHG, the same gap shows up differently. Over 3,200 accounts worth $160M had been routed to the wrong vendors, invisible in the system until a SQL pipeline caught them. The for-profit health plan client from my second internship sends its revenue directly to the Medicare communities it serves, often elderly patients who depend on that income stream being accurate. In surveys of providers, risk adjustment operations are cited above premiums as the primary revenue-generating arm. The compliance reporting I automated wasn't an internal operations problem. It was the operational reliability that keeps that income flowing. The work looks like Power BI and Power Apps. The reason it matters looks like those people.
The less visible change is what this work did to how I think. The trailer-park community gave me an assumption I've carried into every project since: any dataset has a population it's systematically missing, and the real work is usually finding them. At UHG, I wasn't asked to look for the 3,200 misrouted accounts. I went looking because that assumption had become automatic. Mock Trial added a different kind of discipline. Learning to hold cross-examination without improvising past the case materials, staying inside what the evidence actually supports rather than what feels plausible, turned out to be the same constraint that matters in regression work. I didn't connect those two rooms until I was deep into a multicollinearity problem and realized I was doing the same thing I'd been trained to do on a witness stand. These experiences didn't just teach me skills. They changed the lens I reach for first.
Now What
I came across Han van der Maas's mutualism model in Google Scholar in high school while procrastinating on a debate case. The idea stayed with me: math, language, and spatial reasoning develop strong correlations over time not because they share some common factor, but because growth in one actively enables growth in the others. Four years competing in Mock Trial built the same analytic discipline I use diagnosing multicollinearity in a regression model. Decomposing a witness's credibility under cross-examination and isolating a collinear predictor are, structurally, the same problem. My Honors contract in Math Stats II applying statistical inference to network data grew from that same instinct to map how things connect rather than study them in isolation. The degree-plan visualization on this site is a map of how courses and skills actually connected for me, with edges drawn where one opened the next.
The framework I keep returning to for understanding any new domain is Bloom's Taxonomy: remember, understand, apply, analyze, evaluate, create. I use it to locate exactly where I am in a subject rather than treating mastery as binary. MECE (Mutually Exclusive, Collectively Exhaustive) is how I break any domain into its components: no overlap, no gaps, each piece doing its own work. I use AI now not to generate answers but to probe which level of Bloom's I've actually reached on a topic, then push to the next. The combination has let me move across political science, statistics, healthcare operations, and network science without losing the thread between them. The path ahead points toward healthcare data science, not as the obvious next step from UHG, but because the problems there have the same structure as everything I've worked on: operational gaps with real people on the other side of them.
2021 – 2022
Congressional Campaigns
2,000+ doors, census analysis, voter registration for uncounted communities
2023 – Present
Texas A&M
Research, Honors contracts, Mock Trial Co-Captain, hackathons, service
2025 – 2026
UHG · Healthcare Analytics
RCM, Risk Adjustment, Medicare communities, $160M+ in recovered accounts
07 · Contact
Let's talk.
Open to data science, ML research, AI, and analytics roles for New Grad 2027.